Time for a new metric?
P3 Pharmacy,
17 May 2021![]() 2 Min
2 Min
P3 Pharmacy,
17 May 2021![]() 2 Min
2 Min
P3 Pharmacy,
17 May 2021![]() 2 Min
2 Min
Final data for 2020 suggests pharmacies across England are increasingly facing very different scenarios when it comes to prescription numbers.
 Three months ago, when we last looked at the change in year on year prescription volumes (P3pharmacy, January 2021), we highlighted a 12 point gap in average performance by pharmacy, when grouped according to the NHS’s initial subregional STP/ICS geographies. The largest drop, according to NHS Business Services data analysed by PharmData, was the 6.6 per cent fall in average prescriptions in the year to September 2020 recorded in Bristol, North Somerset and South Gloucestershire (BNS&SG), while pharmacies in Leicester, Leicestershire and Rutland (LL&R) recorded a 6.3 per cent increase.
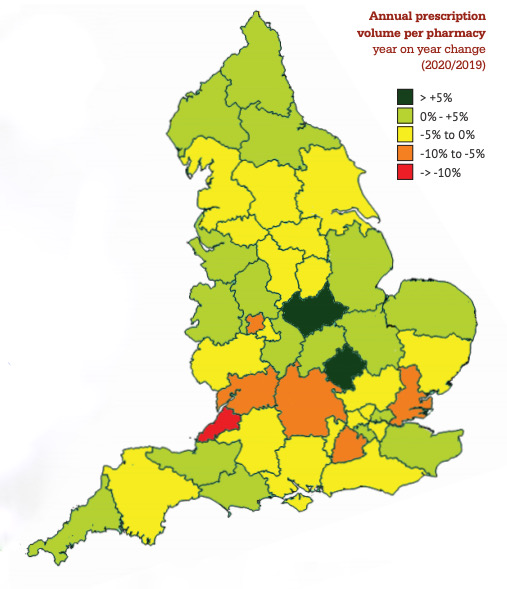
Now that the data is in for the whole of 2020, the gap between the greatest growth in average prescription volumes year on year, using the same analysis, has widened even further to almost 19 per cent. Perhaps unsurprisingly, the same two localities maintain their positions as the areas recording the largest fall or rise. Compared with 2019, pharmacies in BNS&SG dispensed 11.5 per cent fewer prescriptions on average in 2020, down to just over 89,000 prescriptions on average compared to almost 101,000 during 2019. At the other end of the spectrum, pharmacies in LL&R recorded average growth in numbers of 7.2 per cent, to over 96,000 (89,700 in 2019).
The change in average prescription volumes is shown in the map, while the top and bottom five areas in the analysis are shown in the tables.
Variances like this are likely to result from different approaches to prescribing adopted at Clinical Commissioning Group level. Since community pharmacists have reported wholesale adoption in some areas of longer prescribing durations as a result of the pandemic, these data, which contain nine and a half months of prescribing post the first mid-March lockdown-inspired rush, would tend to support this.
Given that the Community Pharmacy Contractual Framework is largely based on averaging across the whole of England, policymakers may need to factor in increasingly wide variances in apparent prescribing rates, especially since these subregional data are likely to mask even greater variances at individual practice level.
| Greatest annual prescription volume growth per pharmacy, year on year change, 2020 vs 2019 | |
| Leicester, Leicestershire and Rutland | +7.2% |
| Milton Keynes, Bedfordshire and Luton | +5.5% |
| Durham, Darlington, Teeside, Hambleton, Richmondshire and Whitby | +4.6% |
| West, North & East Cumbria | +4.6% |
| Shropshire and Telford and Wrekin | +3.9% |
| Largest annual prescription volume decline per pharmacy, year on year change, 2020 vs 2019 | |
| Bristol, North Somerset and South Gloucestershire | -11.5% |
| The Black Country | -8.4% |
| Buckinghamshire, Oxfordshire and Berkshire West | -5.8% |
| Mid and South Essex | -5.8% |
| Surrey Heartlands | -5.3% |
Extracts of PharmData’s analysis can now be found on the P3pharmacy website. Our Pharmacy Performance Analyser includes the collated statistics for monthly items as well as top 10s each month for items, MURs and NMS.