Not all change is equal
P3 Pharmacy,
10 Jan 2022![]() 1 Min
1 Min
P3 Pharmacy,
10 Jan 2022![]() 1 Min
1 Min
P3 Pharmacy,
10 Jan 2022![]() 1 Min
1 Min
We thought we’d start the year with a look at what’s happening to prescription numbers. The latest data from September 2021 suggests pharmacies in England are individually subject to very different pressures.
The latest data from the NHS Business Services Agency (NHSBSA), as analysed by PharmData, confirms that the notion nine months on from our last look that there is uniformity in the growth (or decline) of prescription numbers is one for the birds.
Looking at prescription volume averages across the NHS’s integrated care system (ICS) areas, prescription numbers in the year to September 2021 compared to the year to September 2020 grew by an average of almost 6,000 items (6.4 per cent) per pharmacy to just over 96,000
per annum in Leicester, Leicestershire and Rutland, but declined by more than 12,000 items (13.1 per cent) per pharmacy to just under 82,000 per annum in Bristol, North Somerset and
South Gloucestershire.
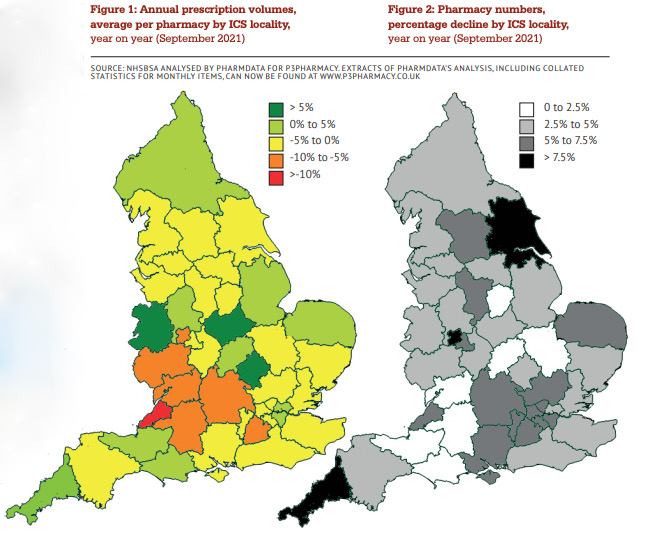
The highest average prescription volumes per pharmacy in the year to September 2021 were found in the 112 pharmacies in Lincolnshire – at almost 130,000 items per annum, followed by Cumbria and the North East (640 pharmacies, 116,000 items) and Northamptonshire (119 pharmacies, 112,000 items).
At the other end of the scale, the fewest average number of prescription items in the same year were dispensed by the 443 pharmacies in North West London, at 63,700. The 271 pharmacies in North Central London dispensed just under 64,000 items, while the third fewest average numbers were in South East London (312 pharmacies, 66,700 per annum). Volume changes year on year are shown on Figure 1, left.
PharmData’s analysis pulls out distance selling pharmacies (DSPs) and records them separately. The number of DSPs was down by 53 in the year, from 421 to 368, but their average prescription item numbers were up by more than 70 per cent, to more than 149,000 in the year to September 2021. DSPs dispensed almost 5.5 million items – comfortably ahead of the 5.3m items dispensed by the 584 pharmacies across Greater Manchester, the largest number recorded for any ICS area.
The September 2021 data also suggests that the pace of pharmacy closures is accelerating. PharmData’s analysis is based on data from 10,533 pharmacies in September 2021, compared with 11,108 pharmacies in September 2020.
In addition to the closure of DSPs, analysis of year on year pharmacy figures suggest a net loss of 37 pharmacies in West Yorkshire, 30 in Greater Manchester and 29 in North West London. There were fewer pharmacies in September 2021 than a year earlier in every one of the 42 ICS areas. The greatest percentage loss was recorded in Cornwall & the Isles of Scilly, down 10 per cent (to 90).
The reduction in pharmacy numbers, expressed as a percentage in each ICS locality, is shown in Figure 2 (right).