NMS in decline; mixed picture on prescription numbers
P3 Pharmacy,
06 Feb 2021![]() 2 Min
2 Min
P3 Pharmacy,
06 Feb 2021![]() 2 Min
2 Min
P3 Pharmacy,
06 Feb 2021![]() 2 Min
2 Min
Concerns that patients may have failed to present at GP surgeries could be behind a fall in completions of the New Medicines Service, according to the latest data from NHS Business Services.
Analysis of the latest numbers by PharmData, split by the NHS’s subregional STP/ICS geographies, reveals that in the 12 months to September 2020, around 833,000 NMS episodes were claimed for in England, compared with over 934,000 in the previous 12 months.
Only six areas showed an increase in provision of the service, with Northamptonshire leading the way. It saw a 10.1 per cent increase in the NMS total, to just over 15,000 in the year to September 2020.
NMS episodes, YoY change (September 2020)
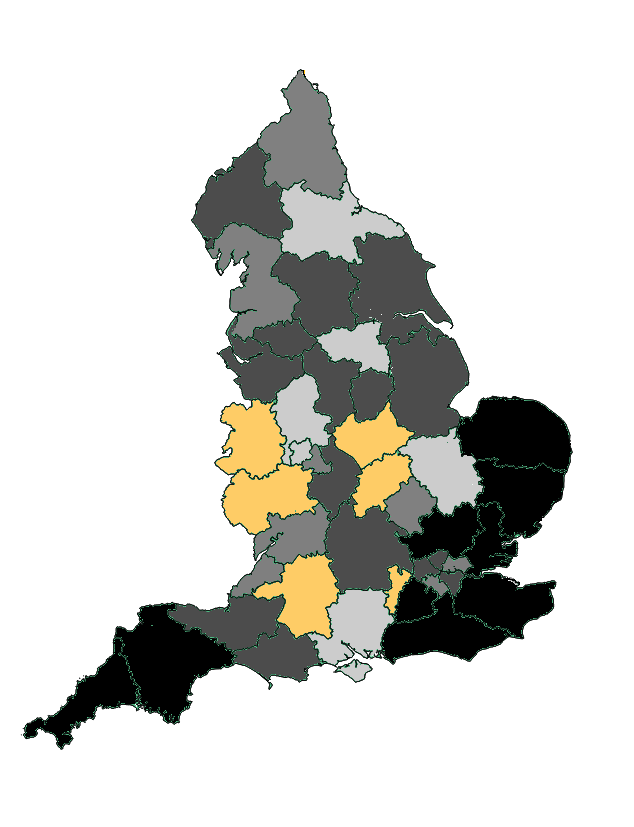
At the other end of the scale, the sharpest decline in total NMS episodes was seen in Derbyshire. Just under 14,000 NMS were delivered in the same period, compared with more than 18,000 in the 12 months to September 2019, a drop of 22.7 per cent. Performance by area can be seen in the map on the left.
When it comes to average numbers of NMS per pharmacy across the 12 months, pharmacies in Northamptonshire led the way, with more than 125 NMS delivered per pharmacy – that’s over 20 per pharmacy more on average than pharmacies in Leicester, Leicestershire and Rutland, who were next. At the other end of the scale, pharmacies in North Central London completed the fewest each, on average, at just under 56.
The tables show the top and bottom five areas in terms of NMS completions per pharmacy.
| Top 5 STP/ICS areas: NMS episodes per pharmacy, year to September 2020 | ||
| NMS episodes | Change, YoY (%) | |
| Northamptonshire | 125 | 9.2 |
| Leciester, Leicestershire & Rutland | 104 | 5.5 |
| Lincolnshire | 99 | -15.2 |
| Milton Keynes, Bedfordshire & Luton | 98 | -6.5 |
| Cornwall and the Isles of Scilly | 95 | -18.4 |
| Bottom 5 STP/ICS areas: NMS episodes per pharmacy, year to September 2020 | ||
| NMS episodes | Change, YoY (%) | |
| North Central London | 56 | -9.7 |
| Nottinghamshire | 59 | -11.8 |
| Birmingham & Solihull | 60 | -5.4 |
| Coventry & Warwickshire | 61 | -10.7 |
| South East London | 62 | -8.4 |
The data on prescription volumes in the 12 months to September 2020 shows a very mixed picture. Average annual volumes per pharmacy fell in 18 STP/ICS localities and rose in the other 26. The largest drop was in Bristol, North Somerset and South Gloucestershire; pharmacies there dispensed just under 91,000 prescriptions in the year, compared with just over 97,000 in the 12 months to September 2019 – a fall of 6.6 per cent.
Prescription volume per pharmacy YoY change (September 2020)
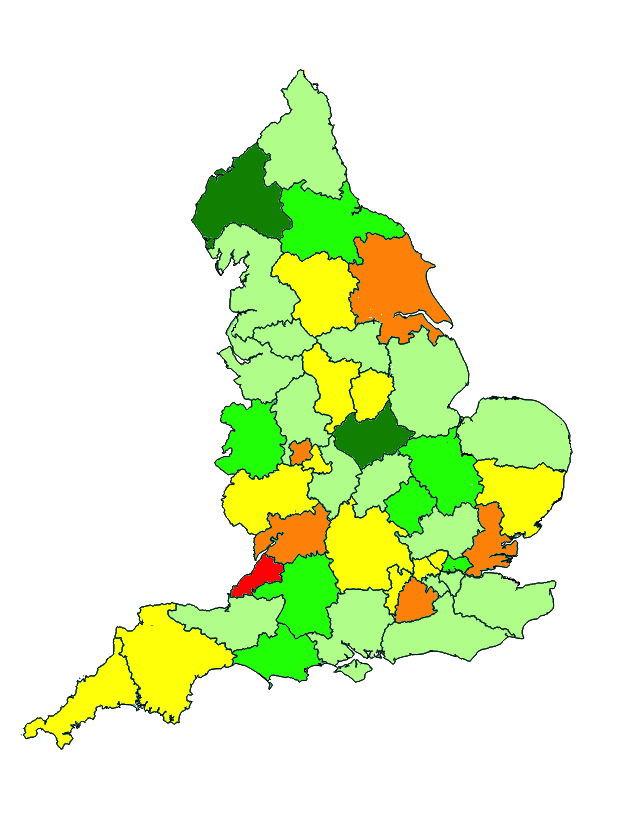
At the other end of the scale, pharmacies in Leicester, Leicestershire and Rutland recorded a 6.3 per cent increase in average prescription numbers to just under 96,000 – up from 90,100 a year ago. Year on year changes in average prescription volumes per pharmacy, by locality, can be seen in the map on the right.