Get house in order to improve cashflow
P3 Pharmacy,
16 Jan 2019![]() 3 Min
3 Min
P3 Pharmacy,
16 Jan 2019![]() 3 Min
3 Min
P3 Pharmacy,
16 Jan 2019![]() 3 Min
3 Min
In the previous article in this series, I suggested that data analytics can help you focus on patients, rather than items, to unlock what we believe is the only long-term sustainable strategy for UK pharmacy. However, this is time consuming to get right, and until you have your house fully in order you will get a better return on your time if you invest it elsewhere.
In this article we look at the first five items on our 20 point plan to maximise business performance in England (see . You will have implemented most or many of these already, but without quality information and efficient processes we have seen that these are often done inconsistently and quite a bit of money gets left behind as a result.
1. Claim on time
On average, pharmacies leave behind about £800 per branch per annum through late claims, and this area is becoming more complicated with more Controlled Drug (CD) and electronic repeat dispensing (ERD) prescriptions.
In England, your timescales for claims are:
• CDs - 28 days from start date to send the dispense notification, then 180 days to claim
• ERDs - 180 days for phase 1 and 365 days from the original start date for subsequent phases
• EPSR2 - 180 days from start date.
Best practice is having all initial claims made within three months at the latest and within two weeks for CDs. A great process with the right information in the right hands at the right time will take care of this.
2. Manage unclaimed prescriptions – deal with month end and outstanding EPS prescriptions
The critical thing to look at here is ‘dispense notification success’ not done by the month end, and claim notifications done by the 5th. There is a lot of cash that can drift out from one month to the next if you are not on top of this. Our data suggests more than £2,000 in cashflow per pharmacy that could have been claimed is left behind at month end (and by the 5th of the month on EPS scripts) to drift into later months. If you’re a small group with 10 branches, that’s £20,000 more in the bank mitigating the cash effect of decreasing margins.
3. Get exemptions right
There are quite a few reasons why patient exemptions do not automatically update on EPSR2 prescriptions. Therefore, having a formal process within the month to identify which ones have not been marked as exempt is important if you are to avoid an unnecessary cash loss. At a cost of £8.80 per item this can add up quickly. Data analytics cannot solve the problem for you, but it will certainly help you to identify and sort out problems sooner than you otherwise might, and will allow you to monitor whether your processes are keeping on top of an ongoing problem.
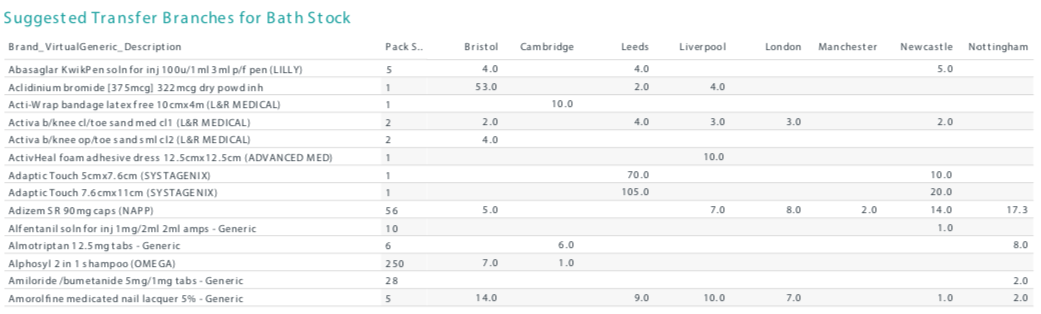
4. Move dead stock every quarter
While the other items on our list are NHS England oriented, as this one is applicable across the UK we will look at it in more depth. Improved management of dead stock is typically worth £2,000-£3,000 per pharmacy every year when done correctly.
Most pharmacies do not keep their stock live, which is where the problem lies. This can, however, be addressed in a small multiple (or conceivably across a small number of pharmacies in a locality) by using an algorithm to identify (and therefore think about moving on) items previously dispensed at least twice in the last year, but not in the last four months, in a particular branch, and which is still dispensed in another of your branches.
Most groups will move suspect stock to their warehouse in the expectation that another branch will order it when they need it, but it works much better to send it to the branch that is still using the item in the first place.
Table 1 provides an example of how this report might look. It shows the items the Bath branch have not dispensed for 4 months, where a previous dispensing record exists. A pharmacist looking at this list can see which items it makes sense to transfer, and which branches are still dispensing each of those items, and therefore where to send them.
Most pharmacies get only value stocktakes, but if you spend a little more for a scanned stocktake, the cost will pale into insignificance if you are able to reduce your dead and slow-moving stock as a result of improved accuracy in the process.
5. Complete MURs consistently each month
While some pharmacies will do their full allocation of MURs, many do not. This may surprise you. Table 2, based on NHS payment data, shows that groups with 50 or more branches which are not the big corporates, completed and claimed for an average of 338 MURs per branch last year. While the theoretical maximum for claims is 400 a year, smaller pharmacies will pull the maximum down, in this group segment to an average of 391, meaning 53 MURs being left behind every year, or £1,484 per pharmacy.
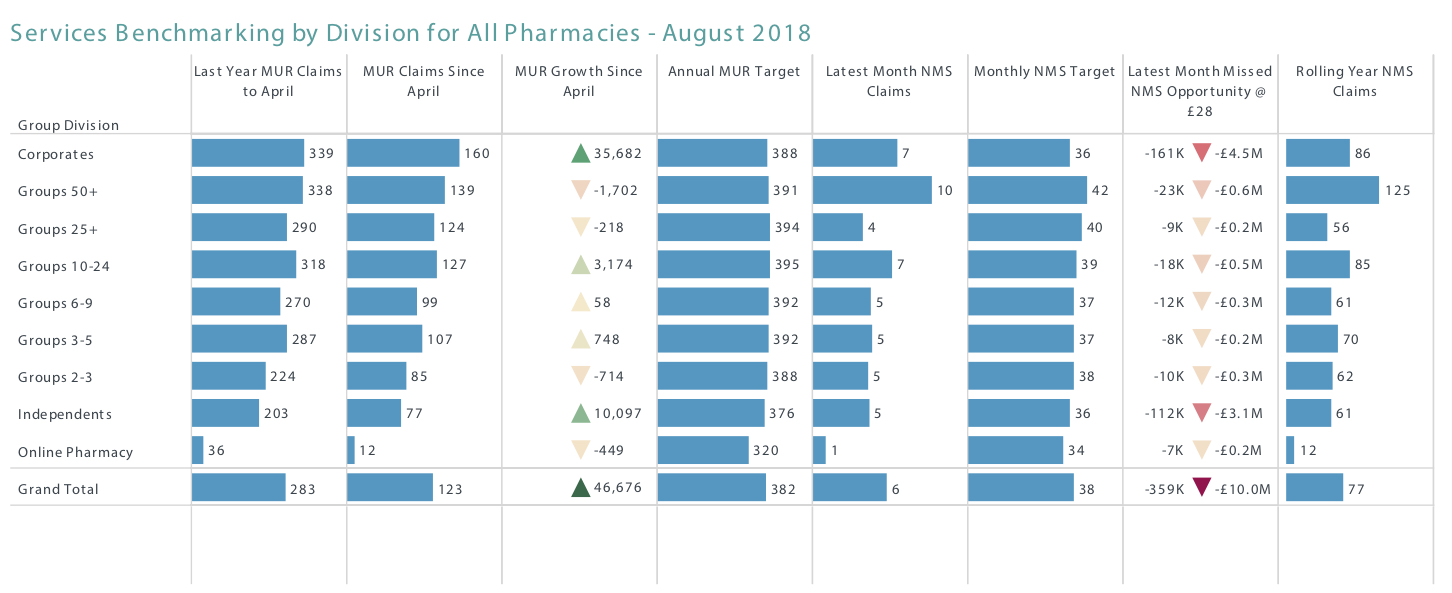
We often see a spurt towards the end of the financial year to get these done, but a regular, even, routine over 12 months makes more sense. A data analytics tool can provide transparency, tracking and help in getting these done on time, so that no money is left behind.
More importantly, patients can get a better, more valuable, service through this approach too. With data analytics, an algorithm can be developed using the NHS criteria for ‘at-risk’ patients, to identify customers who have not had an MUR and who might really benefit from one. An example report, generated from the rules on the PSNC website is shown in Figure 1.
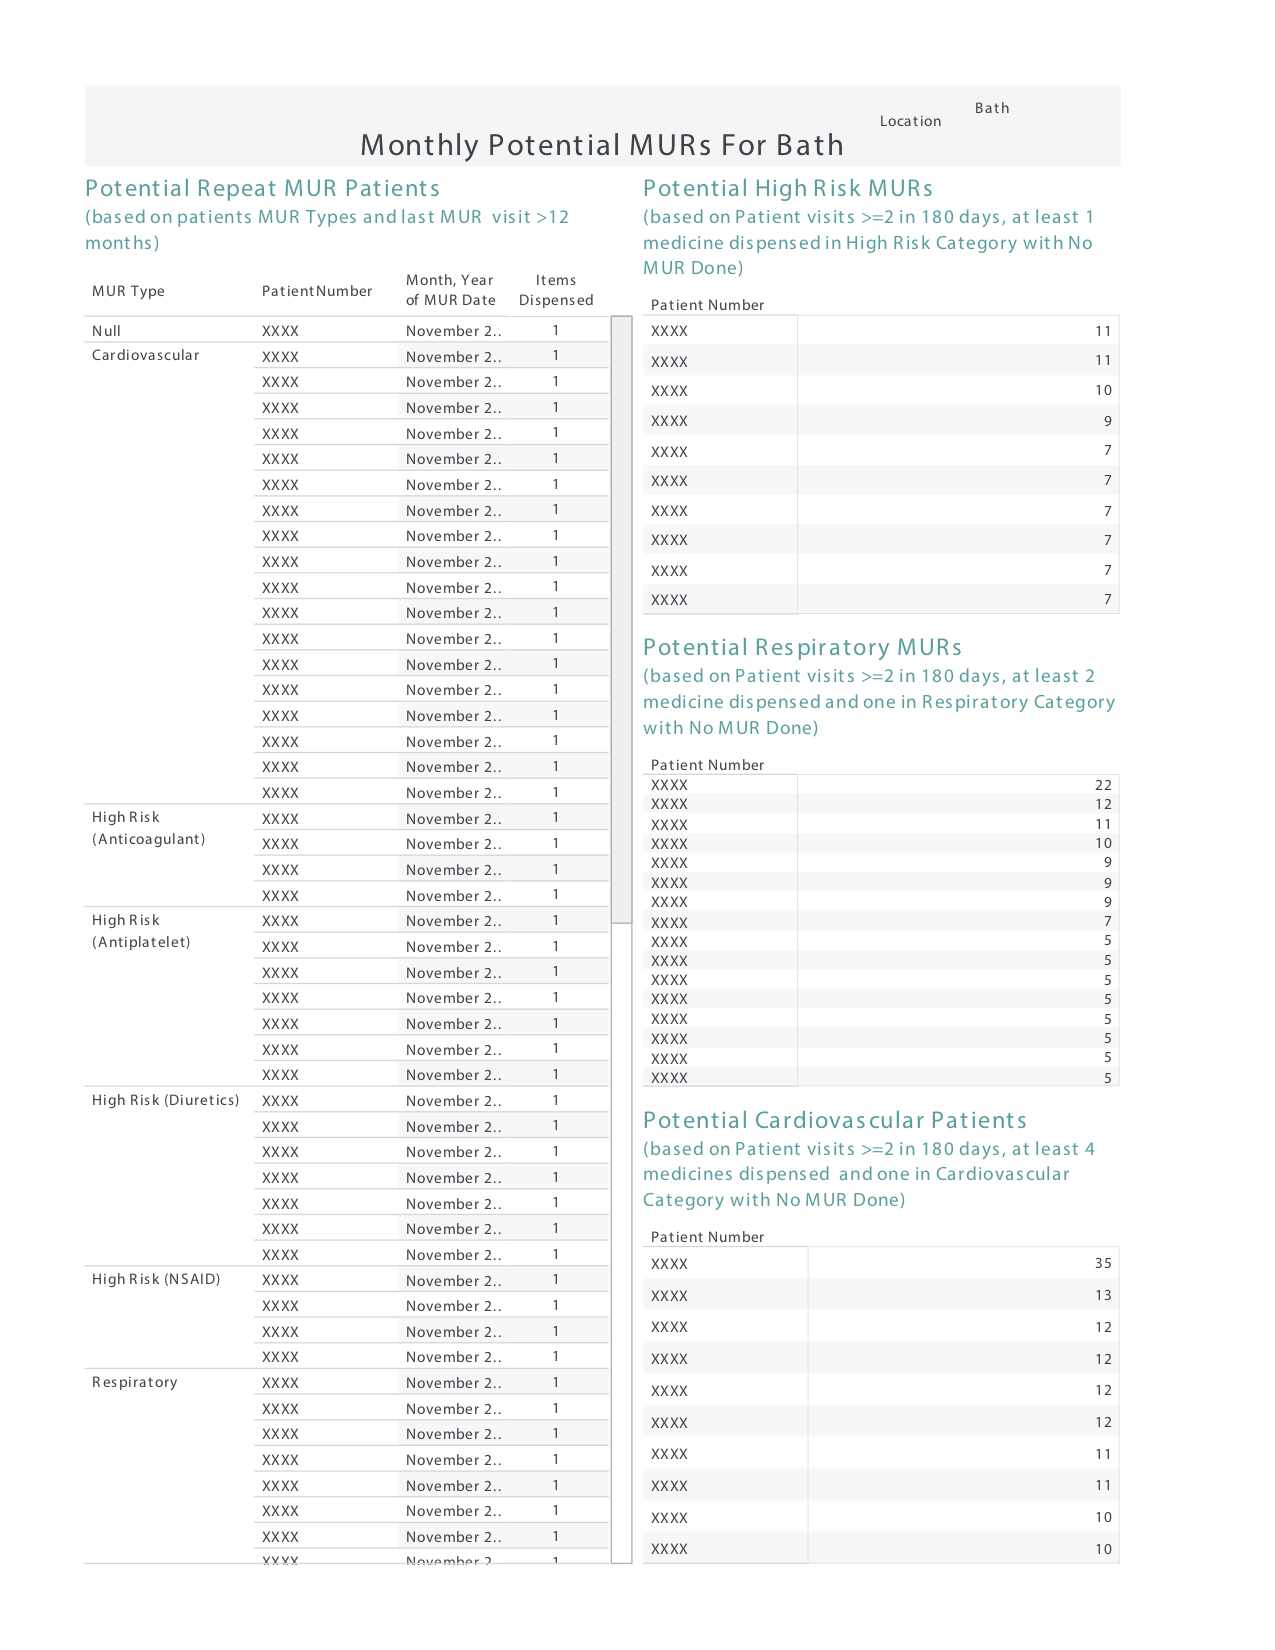
As the NHS changes the criteria or adds new services, the tool can be easily adjusted to accommodate new features.