Can you see it coming?
P3 Pharmacy,
13 Dec 2018![]() 2 Min
2 Min
P3 Pharmacy,
13 Dec 2018![]() 2 Min
2 Min
P3 Pharmacy,
13 Dec 2018![]() 2 Min
2 Min
From the published responses to the funding cuts in England we see predictable responses. Two high profile responses from pharmacy businesses are to cut staffing hours in pharmacies and reduce deliveries. Well Pharmacy, Rowlands and Lloyds have all said that they have cut hours and more recently they have restricted the patient eligibility criteria for home deliveries, and therefore reduced the associated cost.
However, if you are going to reduce pharmacy team resources, then you will have to find out how to do more with less. For instance, how can you provide more services with fewer pharmacy team hours? Data analytics can help here, by providing full transparency across the business and actionable insights.
In 2017, the average NHS reduction in payments was around £42k per annum per average pharmacy (86,000 items per annum). This represents a loss of around one third of EBIDA (earnings before interest, depreciation and amortisation). The cuts have continued into 2018, so this is a crisis by anyone’s standards.
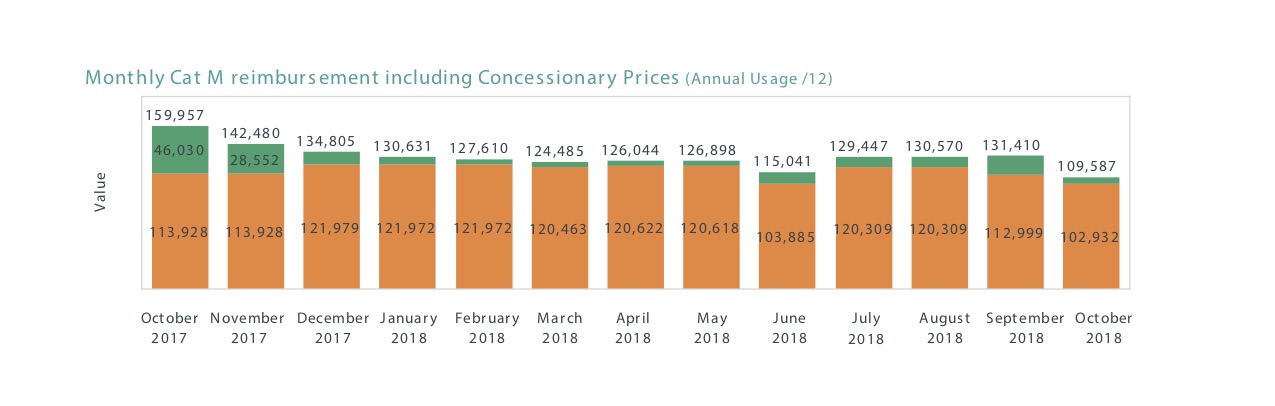
As payments continue to fall it is difficult to plan. If you don’t know what your reconciliation payment is going to be in two to three months’ time, then you don’t know how much cash you have for strategic buying or investment. More commercially driven owners and managers put a considerable effort into trying to calculate their final payment. This is time consuming, and it is often inaccurate because it is typically based on the average item value (AIV) for all of England, not your AIV. However, with a simple visualisation such as the one in Figure 1, you will be able to see what the net effect of Cat M and concession prices will be at the end of each month.
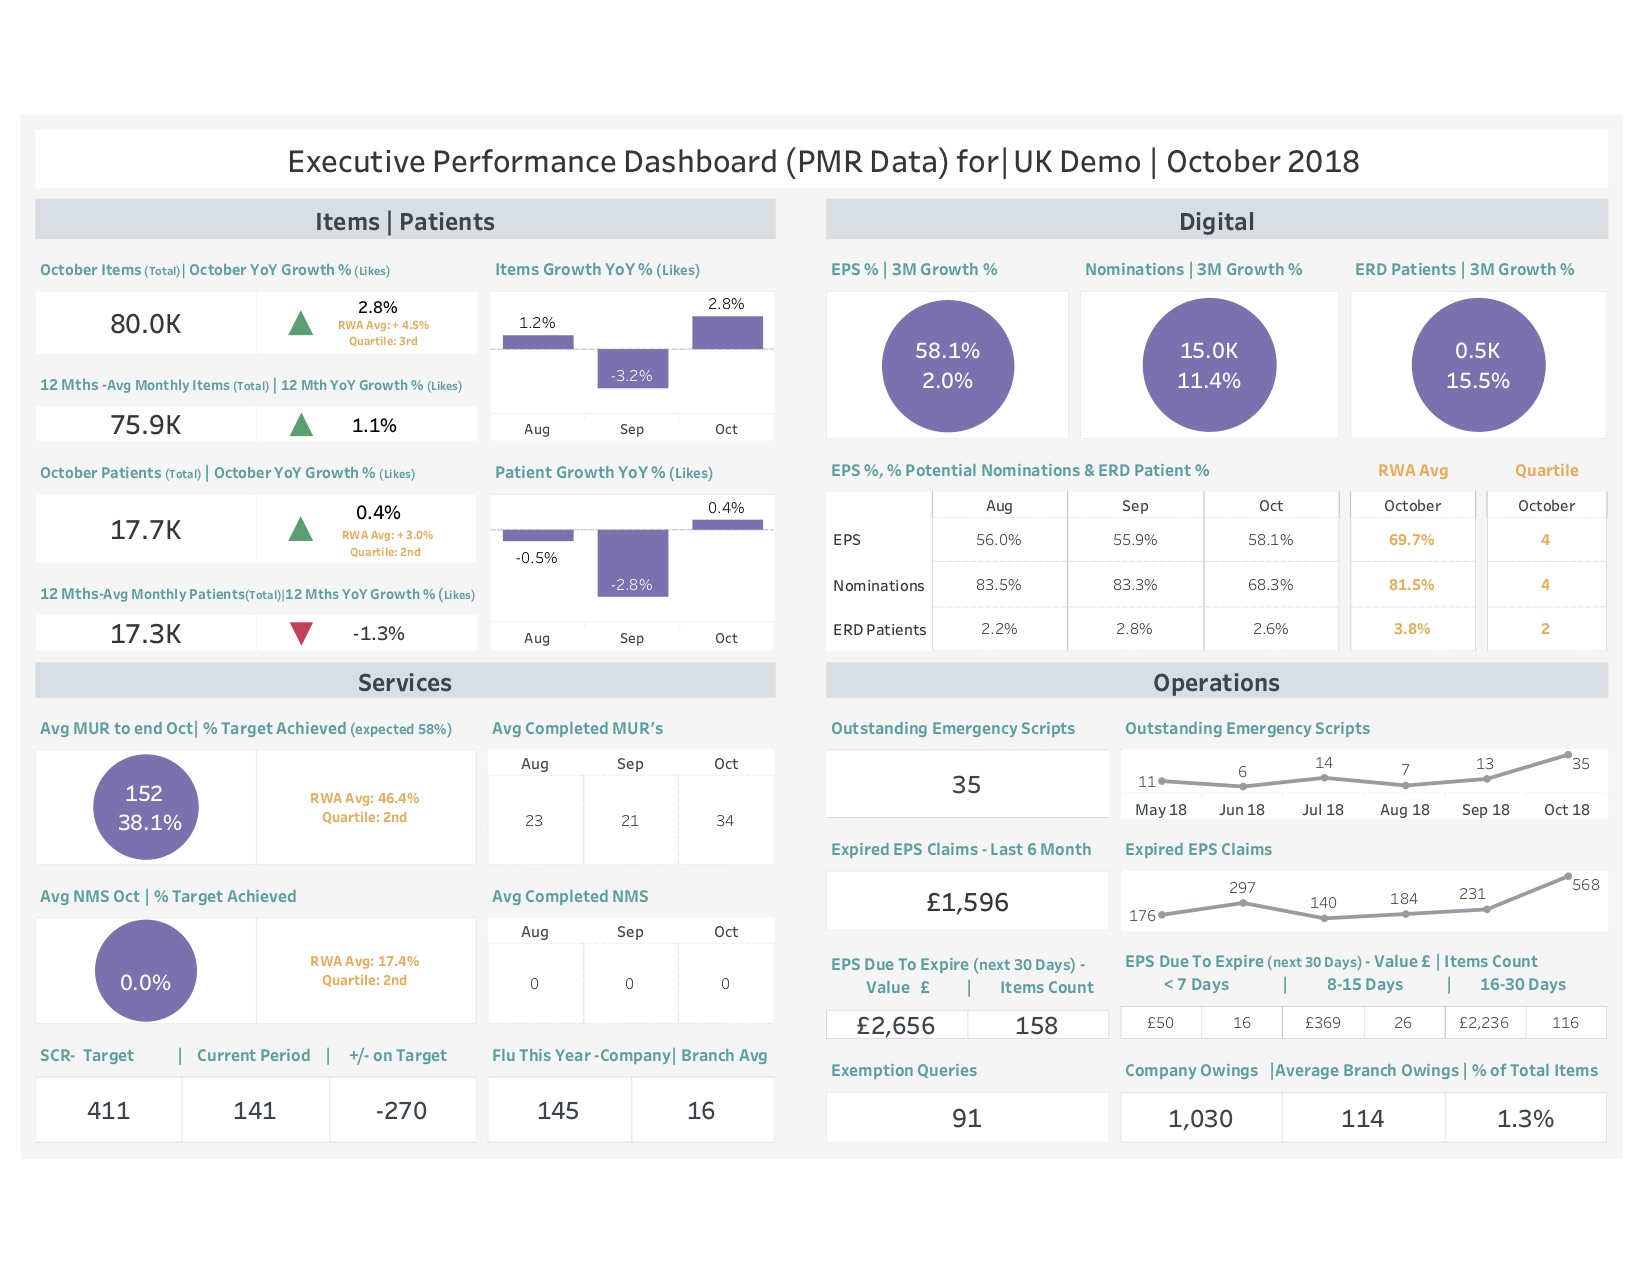
Once you know your payments, you need to have all your key performance indicator data. This is especially true for multi-branch businesses. This illustration dashboard (Figure 2) for a sample nine pharmacy group shows the main business challenges which can be turned into opportunities for improvement (it would look similar for a group with 900 branches). The principles are the same, whether they are developed for head office, regional or branch managers, with drilldowns and modules to drive continuous improvements in each area.
Items or patients?
Looking at the dashboard in Figure 2, the first insight is the interaction between items and patients. Most pharmacy managers do not know why items are lower than expected in a month. There can be many reasons, but the important question is: “Are my items down because my patient numbers are down, or because my items per patient are down?”
It is extremely difficult to see how many patients you had in a month with a PMR, so you are missing this key information. Using data analytics and by making a reasonable assumption about what constitutes a unique patient, it is relatively straightforward. Our pharmacy group customers came up with the following definition for us: unique patients that have been into my pharmacy in the last year, at least once.
In the illustration items are up 2.8 per cent but patients by only 1.1 per cent, so the items gain has come mainly from more items per patient. Is this sustainable? Is this something you have any control over? Focusing on patients with conditions that typically require multiple items will help drive item growth. You need to have a view of your patients and put them into cohorts, but again an analytics solution can help with this and provide a means to track your results.
Who’s worth having?
We can also use data to develop a metric of “patient worth by age group”. In Figure 3 covering our notional chain which has 50,880 patients, of which 41,716 have an NHS number (the others are either private or the NHS number is missing). You know older patients are worth more to you, but it can be reassuring to see younger ones coming through to ensure the long-term viability of your business.
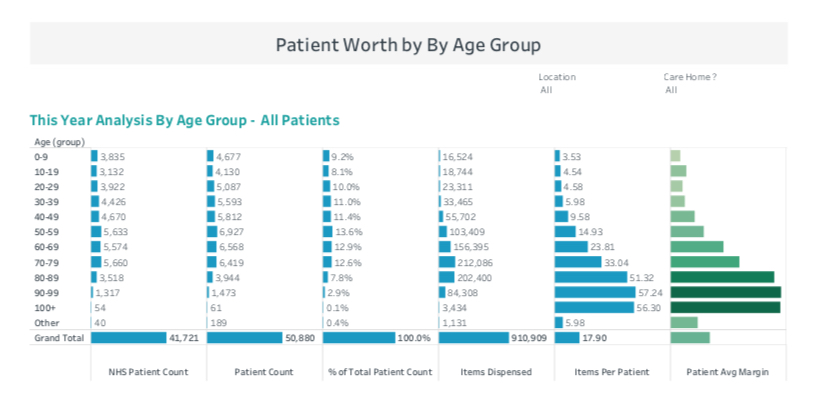
Measuring the value of a customer is not easy, even with sophisticated technology. The fees and margin need to be collated for each patient. The margin is dependent on the price (Tariff or concessionary) at the time of dispensing, and the cost which is subject to wholesaler and procurement discount (if there is one). The calculation has to be done on the molecule dispensed, as branded generics will skew the results.
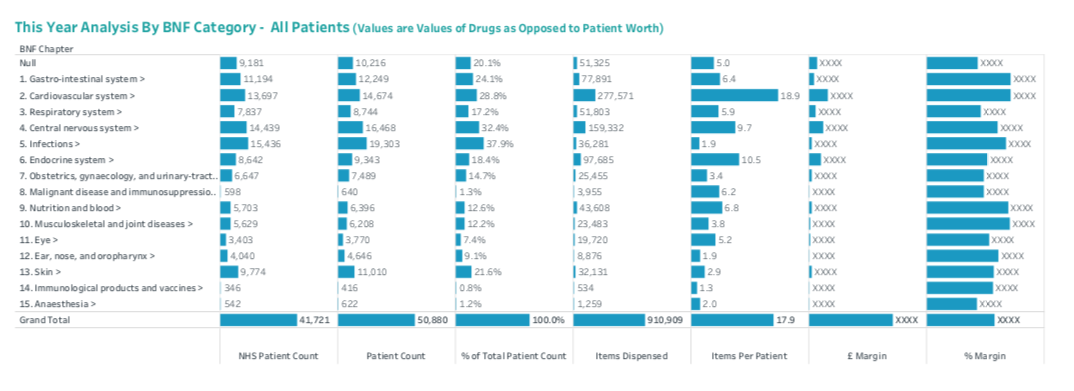
Once you understand the value of the patient all sorts of interesting strategies present themselves. Figure 4 shows the mix of patients by BNF category and the worth of each. You might decide to focus on one or two conditions and become known in your area for excellent patient care in those conditions, driving items and loyalty. This will cost you time and money, but you can track patient conversion to establish a return on investment. You might use a different cohort to understand value, such as your home delivery customers, or the mix of patients in care homes.
Growing your business by focusing on patient opportunities is complex and can be time consuming, however it is probably crucial to your long-term viability. The only limits to the opportunity to improve are your imagination and creativity.
© P3pharmacy, in consultation with Real World Analytics