An increasingly fragile network?
P3 Pharmacy,
01 Dec 2021![]() 1 Min
1 Min
P3 Pharmacy,
01 Dec 2021![]() 1 Min
1 Min
P3 Pharmacy,
01 Dec 2021![]() 1 Min
1 Min
Whilst not unexpected to many, the 2020/21 figures from the NHS Business Services Authority (NHSBSA) show a bigger net loss to the network during the time of Covid-19 compared to previous years. This suggests the hoped-for stability from the 2019/20 –2023/24 Community Pharmacy Contractual Framework (CPCF) is proving impossible to deliver.
The CPCF has time to run – it’s due to end in 2024 – but it looks like, despite the ambition to help support investment in pharmacy by giving some stability, the network has become more fragile.
These official statistics add credibility to warnings about the sustainability of the network and should prompt more serious recognition of the challenges the network faces as a new contract is shaped.
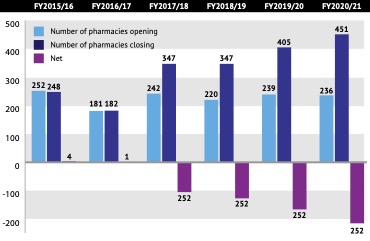
The community pharmacy network in England was contracting even before the pandemic, and the latest statistics show the speed of contraction increasing. According to NHSBSA, at the end of 2020/21, the network stood at 11,636 pharmacies, representing a net fall of 254 community pharmacies compared to five years ago, although some data – relating to pharmacies in one stop primary care centres and out of town shopping developments – is missing.
What is clearer, however, is that the trend in net closures is accelerating (figure 1). Note: consolidations (mergers) are not identified separately.
Whilst data up to 2019/20 suggested that multiples were consolidating at the margin and independents were entering the market, the change in 2020/21 revealed by the figures suggests that both sectors are closing branches at the margin. That would be a worry if it were to suggest that independents are less confident about entering and/or expanding and aren’t taking up the spaces being left by multiples who look to be consolidating rather than growing their estates.
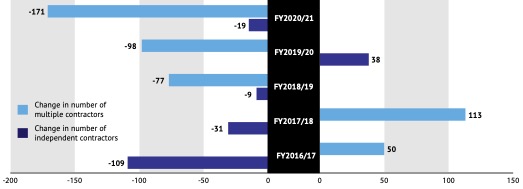
State of market reporting from Christies1 suggests changes in the market are more subtle (figure 2), and that ‘independents’ (defined as five or fewer pharmacies) have picked up extra branches and shifted into the multiples column (six or more). To that trend we can add the one P3pharmacy reported earlier this year2 of regional players picking up stores in the corporate shake out.
Just as was the case in previous years, there are now fewer branches dispensing the lowest volumes (between 0 and 2,000 items), which suggests that those that remain are picking up activity (figure 3). Yet in a shift from the trend towards increasing numbers of branches in the 10,000+ volume bracket, there were fewer branches in this category in 2020/21 (2,277) than in 2019/20 (2,440), making it harder to know if branches are becoming more sustainable.
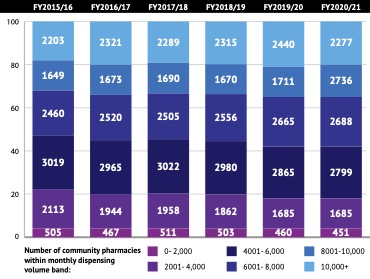
This could simply be a reflection of the 1.8 per cent drop in the total number of prescription items dispensed during the year, from 1.036 billion in 2019/20 to 1.017bn in 2020/21. Even with this, the data does bear out pharmacists’ concerns that there has been some period of treatment inflation. After five years of steady reductions in the average cost of a prescription item, it went from £7.79 per item in 2019/20 to £8.23 in 2020/21 (a 5.6 per cent increase). That represents a significant increase in the cost (to the pharmacy) of dispensing an item, adding to the financial pressures on the sector.
There has been a marked shift in other types of activity. Some of this is driven by the contract. For example, the number of pharmacies providing the Community Pharmacist Consultation Service (CPCS) rose from 7,361 in 2019/20 to 9,284 in 2020/21 (80 per cent of the network for that financial year). Total fees received for the CPCS were up by around 50 per cent, from £3.6m (including fees for the earlier Urgent Medicines Scheme, NUMSAS) to £5.3m, but the data also reveal the loss of MURs from the contract: in 2020/21 (the last year of the scheme), this was £25.9m, down from £62m a year earlier and the peak of almost £98m in 2018/19.
Other changes in activity reflect the Covid-19 pandemic. The number of community pharmacies offering the Community Pharmacy Home Delivery Service reached 9,069 branches in 2020/21, with more than 5.5m service episodes and fees of £33.4m.
This year’s report also captures the continued growth in the delivery of flu vaccinations by community pharmacy in England, with 2,770,330 vaccinations in 2020/21, a 61 per cent increase. Just under 600,000 were delivered in the first year of the national service, in 2015/16.
The reporting period pre-dates community pharmacy involvement in Covid-19 vaccination, which makes it harder to understand the full range of what community pharmacy has done during the pandemic. This lag in what is collected and present by NHSBSA should be recognised by anyone who wants to know just what community pharmacy in England does.
The stability of the network is a function of a host of factors. Many are directly influenced by the CPCF, such as whether new services are reimbursed at a level which compensates for the cost of delivering them. But they also reflect the broader way in which community pharmacy is reimbursed for dispensing.
Whilst the NHSBA statistics in and of themselves don’t show whether the network is sustainable, the fact that the network is losing more branches than it is gaining is a worrying signal for investment. These were, after all, businesses that presumably could not continue as going concerns, at least given the ownership at the time.
As ever, the true value of what community pharmacies in England do won’t come from official statistics. But what these statistics do show is that the concerns being expressed by those in community pharmacy – whether that’s the PSNC3 or the National Pharmacy Association (NPA)4 – about businesses being under financial pressure are being borne out.
These are statistics that should not be ignored as the future contract is shaped.
Data, all charts: Analysis of NHSBSA data from General Pharmaceutical Services - England 2015/16 to 2020/21, October 2021