Plan the various stages and activities of the project and break the tasks down into chunks of work that need to be done. Where possible involve all members of your team in the project to bring in all perspectives and test the plan against their specialist knowledge. A useful tip is to work backwards from the end goal, identifying all the things that need to be done, in reverse order. You may also find it helpful to run an ideas session with the project team to generate ideas and gain input on the issues involved.
Cause and effect diagrams are useful for brainstorming, exploring different perspectives and causative factors that might otherwise be forgotten. By going through the process of building the diagram with your team, everybody gains insight into the problem and explores possible solutions. The people involved benefit from shared contributions, leading to a common understanding of the problem within the team.
 A cause and effect diagram is sometimes called a fishbone diagram (because the diagram looks like the skeleton of a fish)
or an Ishikawa diagram (after its inventor, Professor Kaoru Ishikawa of Tokyo University). A simple worked example of a fishbone diagram is below. Most projects come in late, and often over budget €“ that seems to be the way it is €“ so don't plan a timeline that is too ambitious. Ideally plan for some slippage, and err on the side of caution. Of all the project management tools, arguably the most useful and easiest to understand is the Gantt chart. It helps you think about steps in your project, timelines, people and overlaps between different stages.
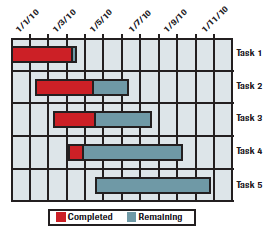
A Gantt chart (such as the one above) is horizontal bar chart that graphically displays the time relationship between steps in a project. It is named after its inventor, Henry Gantt, an American engineer who pioneered its use in the early 1900s.
To create a Gantt chart, list the steps required to complete the project and estimate the time for each step. Then list the steps down the side of the chart and the time intervals along the bottom or top. Draw a line across the chart for each step, indicating how long each step will take. Draw your first line at your start date and the final step will have a line which ends at your planned completion date. In the diagram above, the project has five key blocks of work over several months.
Having completed your chart, your next question is: Who is going to do each step? When assigning tasks to members of your team, be sure to consider these factors:
- Will €“ Who wants to do it; who has the desire?
- Skill €“ Who has the best skills for the task and will work well with everyone else?
- Availability €“ Who is available to do it?
Once agreed, you can put everyone's assigned responsibilities on a simple chart or grid €“ tasks down the page, people along the top with a simple X to mark who is doing what. You could put this on the wall alongside your Gantt chart where everyone can see it.