CPCS on rise as March scripts soar
P3 Pharmacy,
23 Jul 2020![]() 2 Min
2 Min
P3 Pharmacy,
23 Jul 2020![]() 2 Min
2 Min
P3 Pharmacy,
23 Jul 2020![]() 2 Min
2 Min
As Sir Simon Stevens gets out and about in South London to mark 300,000 CPCS episodes and chief pharmaceutical officer Dr Keith Ridge tweets the news that more than 332,000 have been completed since the service started, the latest data from NHS Business Services reveals that all parts of England are now delivering the service.
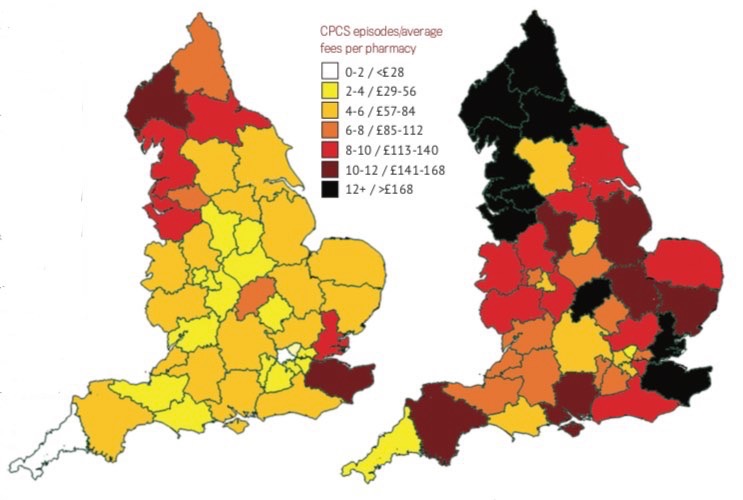
Analysis of March numbers by PharmData, split by the NHS’s subregional STP/ICS geographies, reveals that in the five months to the end of March, just under 108,000 CPCS episodes were delivered, bringing in total fees of just over £1.5m. With half that number completed in the first two months, the service appeared to be growing at a rate of around 50 per cent a month, with a further acceleration to be revealed when figures covering the lockdown are released in due course.
The largest number of episodes for a single area by the end of March was recorded in Cheshire & Merseyside, at 9,767, followed by Greater Manchester at 8,745, and Lancashire & South Cumbria at 6,562. The smallest number were the 267 in Cornwall & the Isles of Scilly, and 658 in Gloucestershire.
In terms of average income, pharmacies in West, North & East Cumbria continue to lead the way, with £296 each, equating to around 21 CPCS in five months, followed by Kent and Medway on £265 (19 CPCS). Those in Cornwall and the Isles of Scilly earned the least, on average. Their £41 each represents around three episodes, while North Central London’s £51 represents almost four. The maps show the growth of the service in the five months to the end of March compared with the first two months of the service.
The March data also reveals the scale of the additional prescription workload on pharmacies during March, as patients made sure they had supplies for an indeterminate period of lockdown and surgeries cleared the decks to handle potential carriers of the virus.
Readers will be familiar with their own numbers, but the tables shows a different cut of the same data – prescription volume by CCG. Needless to say, all areas showed considerable month on month increases in total prescribing.
Leading the way, with a 24.7 per cent increase to more than 437,000 was NHS Calderdale CCG, followed by NHS North & West Reading, which was up 23.8 per cent at 169,000. The lowest increase was recorded in NHS Southwark CCG (up 6 per cent to just over 350,000). The tables show the top and bottom five increases.
| Top 5 prescription volume increases month on month, CCGs, March 2020 | ||
| Prescription numbers | Increase (%) | |
| NHS Calderdale CCG | 437,853 | 24.7 |
| NHS North & West Reading CCG | 169,446 | 23.8 |
| NHS Fareham & Gosport CCG | 328,103 | 23.7 |
| NHS Surrey Heath CCG | 140,881 | 23.4 |
| NHS Islington CCG | 263,386 | 22.6 |
| Bottom 5 prescription volume increases month on month, CCGs, March 2020 | ||
| Prescription numbers | Increase (%) | |
| NHS Southwark CCG | 350,675 | 6.0 |
| NHS Corby CCG | 135,738 | 6.3 |
| NHS Slough CCG | 210,741 | 6.7 |
| NHS Bradford City CCG | 227,303 | 6.9 |
| NHS Redbridge CCG | 387,420 | 7.5 |
PharmData combines official statistics with advanced web presentation technology to monitor pharmacy performance of key service and business indicators at the store level.