Contractors maximise service income to mitigate cuts
P3 Pharmacy,
16 Nov 2018![]() 1 Min
1 Min
P3 Pharmacy,
16 Nov 2018![]() 1 Min
1 Min
P3 Pharmacy,
16 Nov 2018![]() 1 Min
1 Min
The latest official NHS statistics for July 2018 show almost 20 per cent year on year growth in Medicines Use Review completions across the country. In data compiled by PharmData, the rolling annual total of MURs claimed totalled an average of 351 per pharmacy in July, up from 297 per pharmacy a year ago.
If achieved over a full financial year, pharmacies will claim just under 88 per cent of the allocated service income, and complete almost 4 million MURs in 2018/19. Like the growth in NMS interventions reported featured last month, this concentration on ensuring service income is achieved follows the implementation of the funding cuts. If claims in prior years were low, then completing services would provide some mitigation. Paradoxically pharmacies who were already completing the maximum number of MUR interventions would not have been able to mitigate the cuts this way.
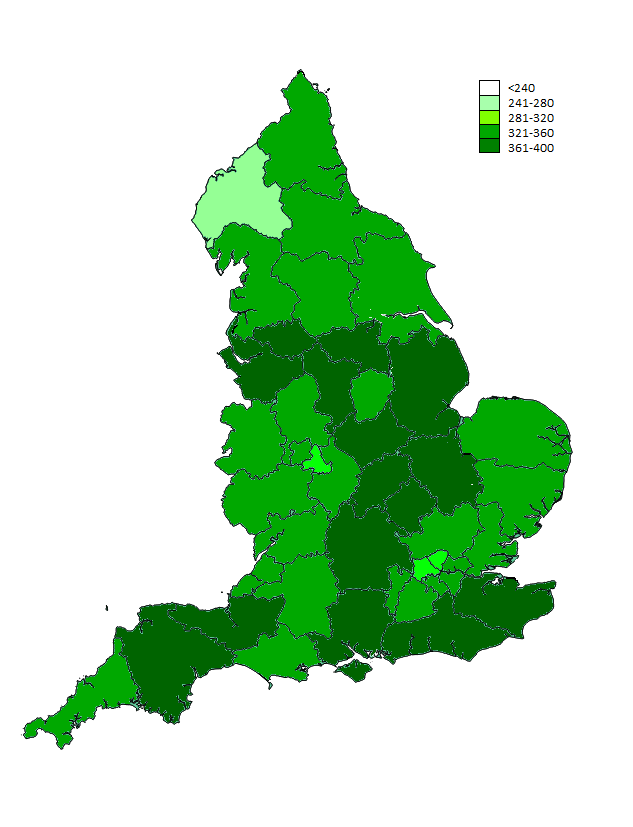
When grouped according to the geographies of the NHS’s Sustainability & Transformation Partnership (STP) localities, pharmacies in South Yorkshire & Bassetlaw stand out, with MUR completions and claims averaging 393 per pharmacy. Cheshire & Merseyside, Devon, Hampshire & Isle of Wight, and Milton Keynes, Bedfordshire & Luton complete the top five.
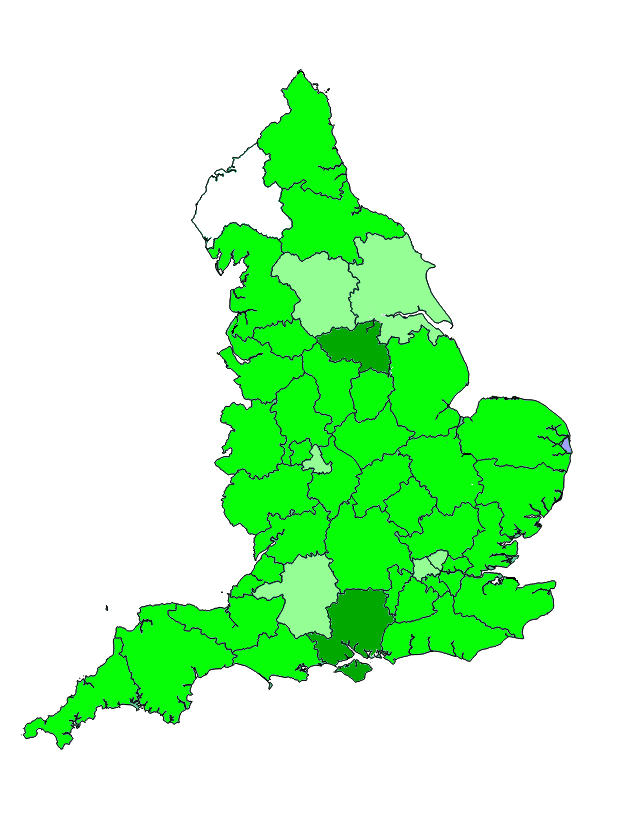
All STP areas recorded double digit growth in MUR completions, with pharmacies in Bath, Swindon and Wiltshire completing almost one third as many (+30.1 per cent) in the year to July 2018 when compared to the previous year.
Pharmacies in 15 STP areas are now averaging more than 90 per cent of the annual capped number of claims, while in a further 26 localities claims are averaging more than 80 per cent of the 400. In the same month last year, annual running average MUR totals topped 80 per cent in only two areas, while 35 areas were running at over 70 per cent.
The lowest performing locality was West, North & East Cumbria, with an average 280 MUR completions in the year to July, although up 23.3 per cent on last year. North Central London was the only other STP locality with an average number of MUR claims below 300.
MURs Top 5 Year to July 2018, average per pharmacy
| South Yorkshire & Bassetlaw | 393 | +22% |
| Devon | 372 | +17% |
| Hampshire & Isle of Wight | 372 | +16% |
| Milton Keynes, Bedfordshire & Luton | 372 | +19% |
| Cheshire & Merseyside | 371 | +21% |