


 Use trends to plan ahead
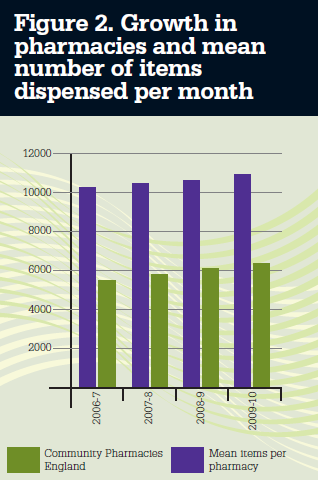 It is also possible to use MS Excel to monitor trends and to help you make predictions for your business with some accuracy. Figure 2 shows the growth in pharmacies and mean number of items dispensed per month over the period 2006 to 2010. Both values appear to be growing in a linear fashion with time. It is possible to use Excel to calculate how close these lie to a straight line and what is the best straight line fit and use that to try to predict future trends.
To do this you need to calculate the correlation coefficient (CC). A coefficient of 1.0 indicates that all points lie on the best straight line and a figure of 0.0 indicates the numbers are random and do not fit any trend. A positive correlation indicates a growing trend and a negative one a
falling one. For the two lines in Figure 2 (blue and green bars), the CCs are community pharmacies + 0.998 and for pharmacy items +0.998. Thus there is good fit for a straight line. (Note: the fewer the number of points, the higher the CC needs to be, and it will always be 1 for two points.)
MS Excel allows you to calculate the slope of the best line (growth rate) and the intercept on the Y axis to make predictions at certain points. For example, we would identify the number of pharmacies in 2006 as 10,119 with a growth of 186 per year.
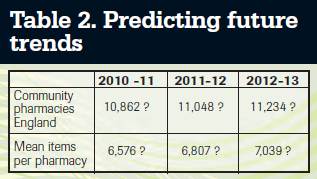 You can then start to predict the future, so that in 2011-12 the number of pharmacies is estimated at 10,119 + (4 x 186) = 10,862 etc as shown in Table 2.
The more years' data you have the more
your predictions are likely to be accurate.
Nearer predictions, such as for 2010-11 are more likely to be correct than further ones, such as for 2012-13.
Does it all add up?
Data from pharmacies is currently being used to inform the renegoitiation the community pharmacy contract for England. The Cost of Service Inquiry 2011 report (www.psnc.org.uk) has a range of useful data to compare your own pharmacy to, as well as offering a snapshot of the national picture.
Looking at trends, comparisons and your own pharmacy data may help you decide whether to start or stop a pharmacy service, depending on what you have discovered. Studying the predictions of future script volume in Table 2 might be useful or not €“ there is no guarantee that predicted figures will become a reality. But as a rule, the more information you can obtain easily and apply to the services you manage, the better informed you, and the decisions you take, will be.